
Reiseziele nach Ländern
Weit entfernte Orte entdecken, fremde Düfte riechen, andere Kulturen kennenlernen, unbekannte Gerichte kosten. All das macht das Reisen aus. Es geht nicht um einen Urlaub, in dem man einfach mal abschaltet. Auf Reisen begegnen uns Herausforderungen, von deren Existenz wir vorher gar nichts ahnten. In unseren Artikeln nehmen dich mit auf unsere Entdeckungstour rund um die Welt. Begleite uns bei unseren Abenteuern und komm mit auf die Reise!
Die bisher von uns besuchten Länder:

Reisekarte
- Hellgrün: Von uns gemeinsam bereiste Länder
- Dunkelgrün: Von uns jeweils einzeln bereiste Länder vor der Weltreise
- Gelb: Hier befinden wir uns gerade
Alle Länder im Überblick:
Klicke einfach auf eines der Länder und du kommst zu einer Übersichtsseite mit allen Blog-Artikeln zu diesem Land
Asien
 Urlaub in China
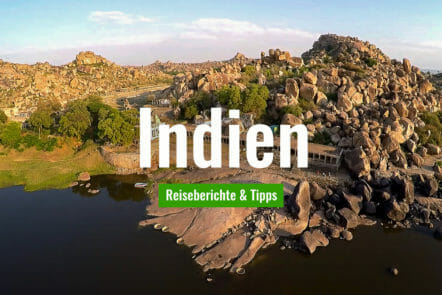 Urlaub in Indien
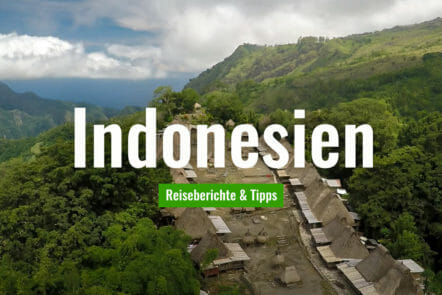 Urlaub in Indonesien
 Urlaub in Malaysia
 Urlaub in Sri Lanka
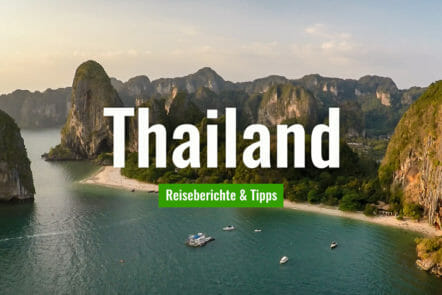 Urlaub in Thailand
Afrika

Europa
 Urlaub in Deutschland
 Urlaub in Frankreich
 Urlaub in Großbritannien
 Urlaub in Polen
 Urlaub in Tschechien
 Urlaub in Ungarn
 Urlaub in Zypern
Warum fehlt unter Europa „Italien“?.Deutschland,Frankreich,Grossbritannien i.O!.. Itaien ist eine der wichtigdten Destinationen kulturell, Urlaub, Geschichte u.a.m.
Siehe oben!
Ich möchte im Juli diesen Jahres nach Tansania und Sansibar reisen. Im Gepäck will ich meine Mavic Pro haben.In Eurem Blog schreibt Ihr, das ein Formular im Anhang des Gesetzestextes zur Neuen Drohnenanmeldung bei der Luftfahrtbehörde in Tansania vorhanden sein soll?
Ich kann dort leider nichts finden!
Könntest Ihr mir dieses Formular per eMail schicken?
Vielen Dank im Voraus,